
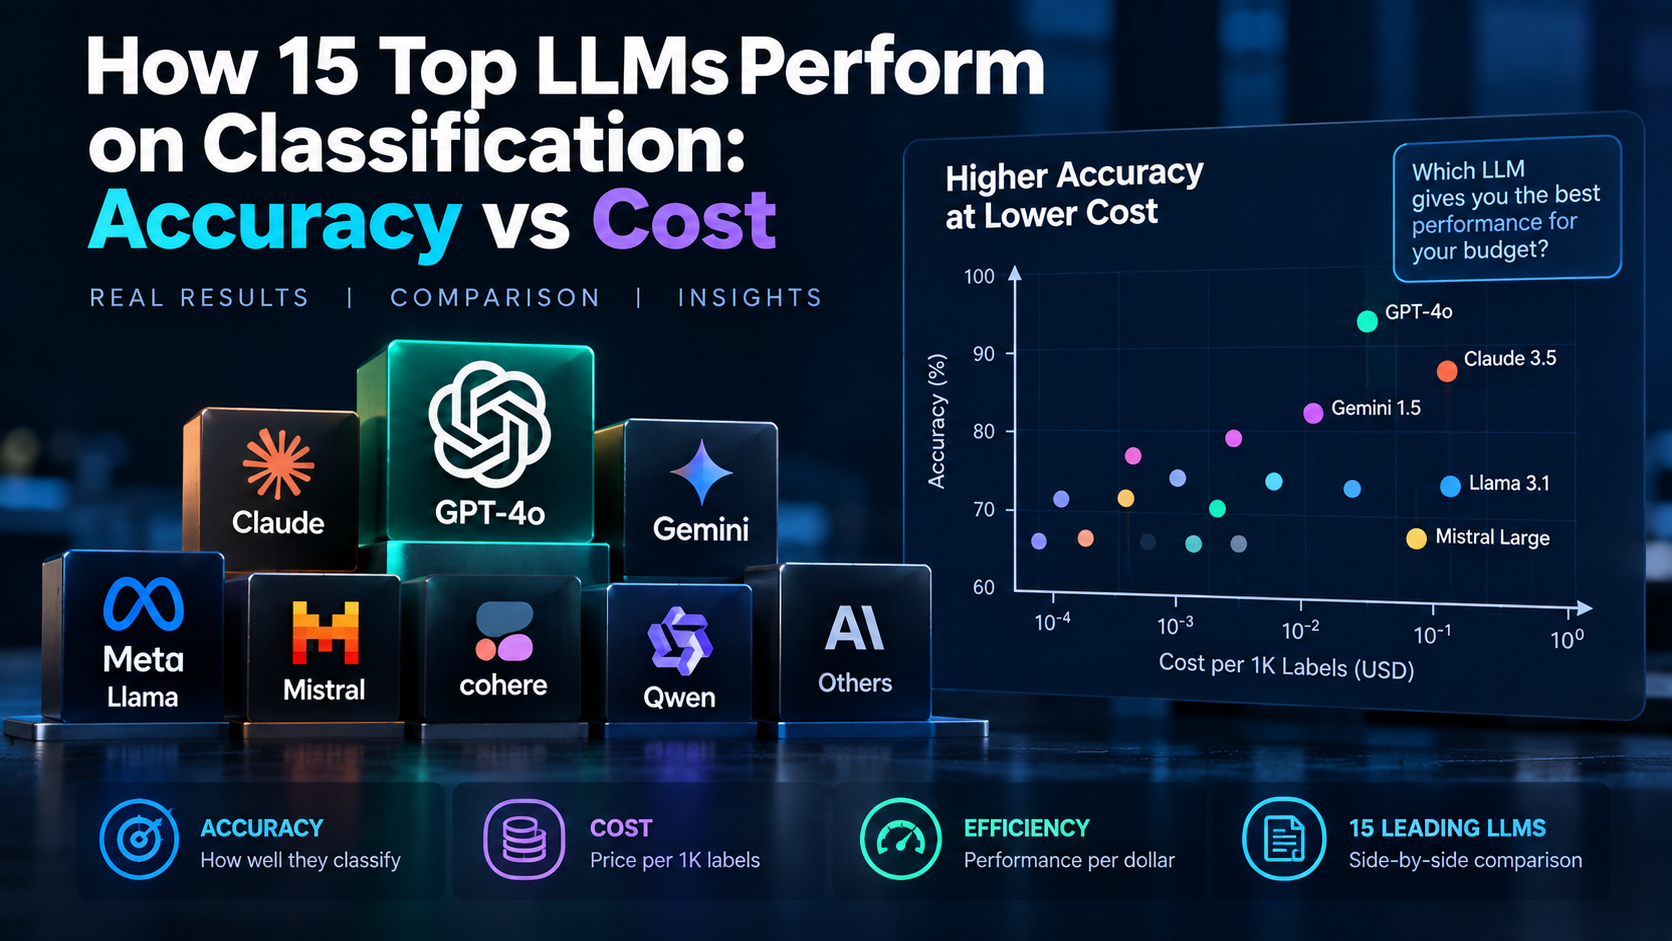
Text classification used to be a project. You gathered a labelled dataset, trained a dedicated model, evaluated it, deployed it, then watched it decay as your production data drifted away from your training distribution. Large language models collapsed that pipeline into a prompt. The question is no longer whether an LLM can classify text, but which one gives you the accuracy you need at a price you can live with.
That second half matters more than most benchmark tables admit. Between the cheapest and most expensive models on the market there is roughly a hundredfold difference in cost per million tokens. The accuracy gap between them, on ordinary classification work, is usually a few percentage points.
Why classification is the right task to benchmark
Classification is unusually well suited to honest comparison. The output space is closed, so grading is mechanical rather than a matter of taste. There is no rubric, no judge model, no argument about whether one summary reads better than another. You either matched the label or you did not.
It is also the task most often sitting quietly inside a production system: routing support tickets, flagging content, tagging documents, detecting intent, scoring sentiment. These are high-volume, low-glamour jobs where per-call cost compounds fast, which makes the cost axis real rather than theoretical.
What to measure
Accuracy alone is a trap on imbalanced data. If 95% of your tickets are routine, a model that always predicts “routine” scores 95% and is useless. The metrics worth tracking together:
- Precision — of the items the model flagged, how many deserved it. This is what your team feels as false-alarm fatigue.
- Recall — of the items that deserved flagging, how many the model caught. This is what you feel as the thing that slipped through.
- F1 — the harmonic mean of the two, useful as a single number when you have no strong preference between the failure modes.
- Cost per thousand classifications — the axis that decides whether the whole thing ships.
Which of precision and recall you weight is a product decision, not a modelling one. A fraud filter and a spam filter want opposite things from the same confusion matrix.
The Pareto frontier is the only chart that matters
Plot every model with cost on one axis and your chosen quality metric on the other. Most models land strictly inside the frontier: there is something else that is both cheaper and better, so they are never the right answer. The handful on the frontier itself represent genuine trade-offs, and your job is to pick a point on that curve rather than to pick “the best model”.
Three clusters tend to emerge. Frontier models from the major labs take the top of the quality axis and the top of the cost axis with them. Mid-tier and distilled models — the “mini” and “flash” tiers — sit in a band that captures most of the quality at a fraction of the price, and this is where most production classification should live. Small open-weight models anchor the cheap end, and on narrow, well-specified tasks they are frequently competitive enough that the gap does not justify the bill.
Where the real gains are
Before you upgrade to a more expensive model, exhaust the cheaper interventions. In practice they move the needle more than a tier change does:
- Fix the label definitions. A surprising share of apparent model error is disagreement about what the categories mean. If two human annotators disagree on 12% of your examples, no model will exceed 88%.
- Add a handful of examples. Few-shot prompting with well-chosen edge cases routinely beats a zero-shot call to a model one tier up.
- Constrain the output. Structured outputs or a strict enum eliminate an entire class of parsing failures that otherwise show up as accuracy loss.
- Cascade. Send everything to the cheap model, and route only its low-confidence cases to the expensive one. On a typical distribution this captures most of the frontier model’s quality at a small fraction of its cost.
Run it on your own data
Published benchmarks tell you which models are plausible candidates. They cannot tell you which one wins on your data, because your label set, your domain vocabulary and your class balance are not in anyone’s benchmark suite. Assemble a few hundred hand-labelled examples from your actual production traffic, run your shortlist against them, and plot your own frontier. It is an afternoon of work and it will contradict the leaderboard more often than not.